
Kevin at saskatoonhousing bubble has posted the first of a two part review of the Vancouver RE market:
‘The Vancouver Real Estate Market: Booms Bubbles and Busts’ (saskatoonhousingbubble, 25 Jan 2013).
Take a look at the entire article at the site.
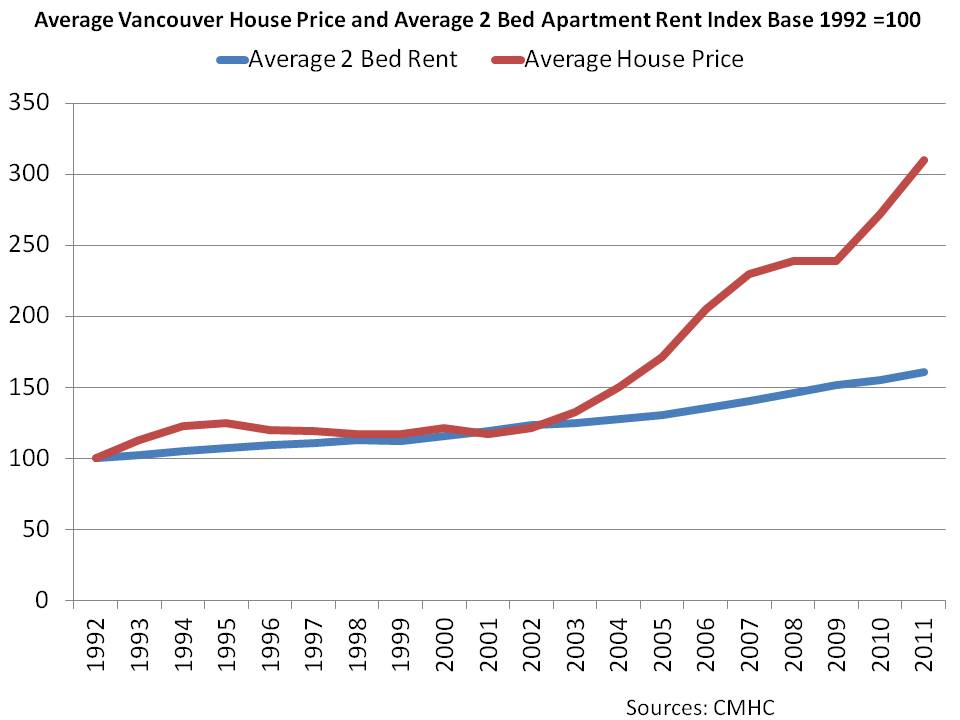
Here we repost two of the charts:

Thanks for the analysis and the post, Kevin.
Vancouver RE is at about twice the price it should be, based on fundamentals such as rental yield and incomes. – vreaa


In 2002, I advised one my younger golf buddies (mid twenty, single) to stop renting and buy 1 brm condo. He did and could easily afford it.
After that, we drifted apart ( he’s a much better golfer than I).
A met him again a coupe of weeks ago, and we talked about RE and how “lucky he was” to have bought 10 years ago. He said his condo has more than doubled, and if he wanted to buy the same unit now, he could not afford it.
He said some of his buddies are jealous of him as they missed the boat and are still renting.
All this begs the question: if hardworking blue collar men and women in their mid thirties cannot afford to buy a simple condo,
WHO IS BUYING?
Who is buying? People like your buddy who gained from price appreciation on phony equity, who are re-leveraging into buying a larger or second property. Yes, the younger folks have missed the train and must now 'save' to make a down payment, however going into saving mode has huge implications for people like your buddy who will see their equity rapidly evaporate.
With regards to price-to-income ratios: I believe what is widely missed by many (because they often only look at data in ratios or percentage terms) is the 'amount of dollars' or debt relative to one's income. It is easy to assume that the person or household who put down 5% on a home is more levered then the person who put down 30 or 40%, but that is not the case, because what matters is the amount of dollars levered proportionate to ones income. The following table explains.
As the above table shows using a household income of $80,000; a buyer who put down 5% on a $400k home is levered 4.8 times actual debt-to-income, whereas the buyer who put down 40% on a $1 million dollar home is levered 7.5 actual debt-to-income. This is the real measure of how much leverage a buyer takes on because the only backstop one has to pay the debt is their income.
Another way to look at it is: Van's average detached price as of December is $1,078,495 and was $524,300 in 2005. If you adjust today's price for inflation, a detached home at today's value was $957,475 in 2005. Now use the same method for income you'll see where the discrepancy is.
So what are buyers and lenders basing the size of mortgages on if they're not using actual debt (in dollar terms) to one's income? i) Homeowner's equity: primarily based on the accumulation of more buyers taking on more debt to drive prices higher (a ponzi) and ii) Access to more debt: banks and lenders continued to approve debt on servicing ratios, not the actual amount of dollars relative to one's income, as explained above.
This is why when lending stops, the market falls into a collapse.
Watchdog,
Let me rephrase my question. WHO WAS BUYING in the last 3 or 4 years, driving the prices into the stratosphere.
My former golf buddy, who makes 50 k a year?
You gotta be kidding me.
Tsunami,
Who was verifying incomes in the last three years? Nobody. Anyone who wanted a mortgage x times larger then their income got one with a stated income, and that includes buddies like yours who make 40-50k who could claim another 30-40K with some BS reference letter. Banks and brokers didn’t care. It became a normal practice, and here’s why.
This broker was charged $4,800 per offense and mostly likely made more on commissions. So if the consequence of falsifying applications is less then the reward, who cares?
Maybe not your buddy, but others in a similar position definitely were buying and are buying now, often with family help.
So, my golf buddies were buying million dollars condos and mansions in Vancouver West?
Cheap S.O.B.s. They tricked me. And I always bought the beer after a game of golf.!
Thanks Watchdog for reminding me that there is a sucker born every minute
Canadian Watchdog (@CanadaWatchdog)
Very well explained. Thanks
I do well for myself financially, and although could afford to buy, but why would anybody want to buy RE in Van unless it corrected by 25-40 percent.
I have lived in US and Europe, and am amazed at the lack of common sense in most people when it comes to RE in Van. The RE gains from 2005 to 2011 were an anomaly, and by definition a ponzi structure.
Van economy is a one-trick pony, buy and sell houses.
“All this begs the question: if hardworking blue collar men and women in their mid thirties cannot afford to buy a simple condo,
WHO IS BUYING?”
Looking at the sales figures at the moment – not many people.
Part of the issue recently has been people buying property they can not afford anyway. Look at the monthly repayment – that is all you need to know regarding whether you can afford it! Apparently…
pffft! … http://tinyurl.com/al32hf7
And if you post a graph of housing prices vs mortgage debt, VOILA!
A perfect match. Not that difficult to see the reason huh.